
Who Led Share of Voice Among AI Code Builders, June to August 2026
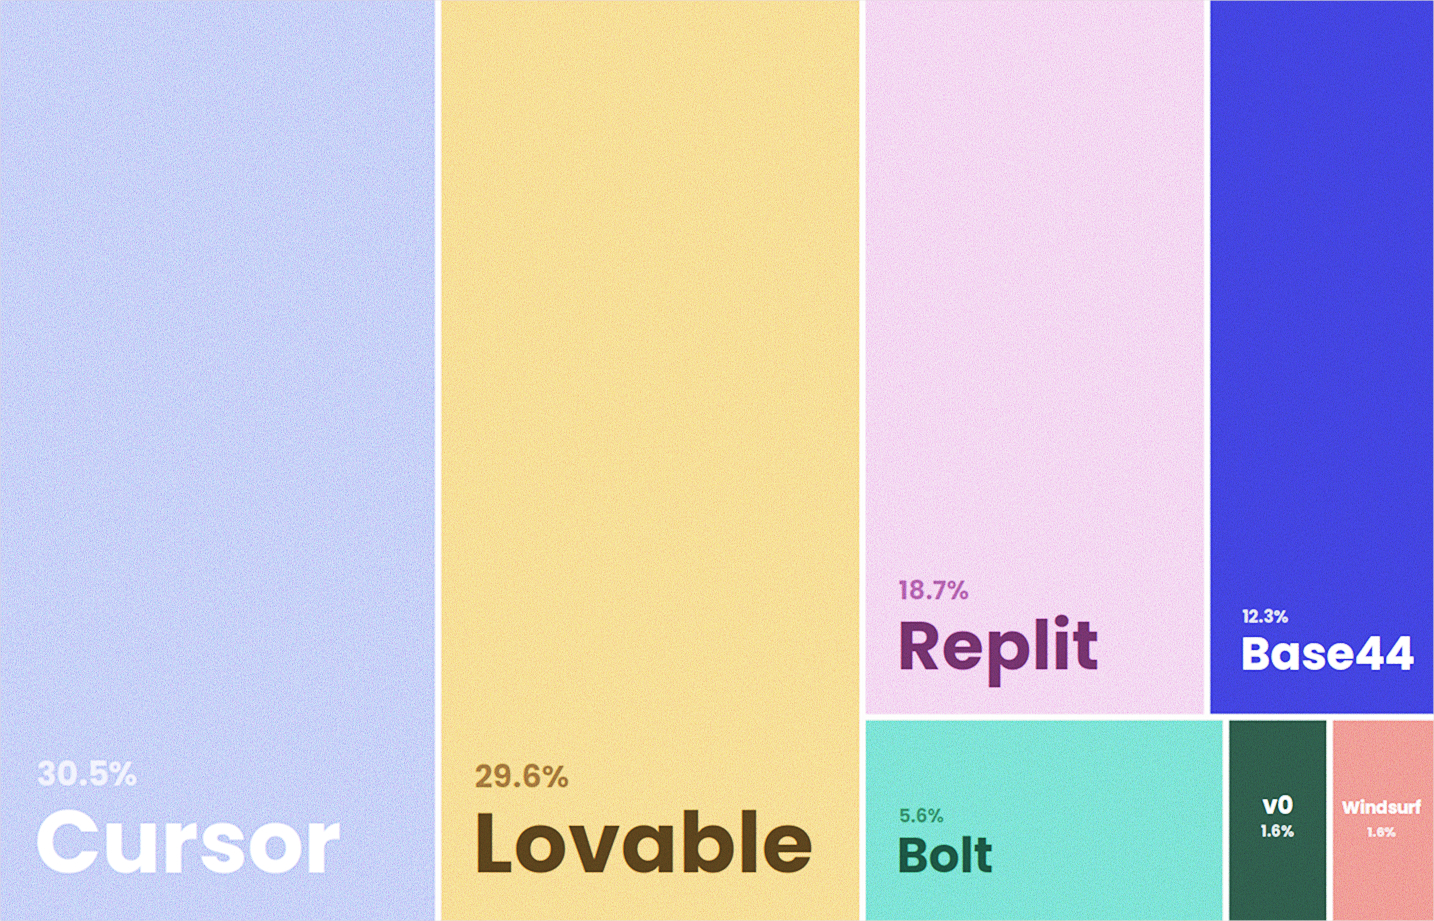

Across seven AI code-building tools, the category usually shorthanded as AI codegen, tracked in Delve from June through August 2026, Cursor held the largest share of voice for the period. Lovable moved the most, and by August it was ahead.
Share of voice here means one thing: of the qualifying coverage about this set, what share named each brand. It is a volume measure. It does not say the coverage was positive, on message, or tied to revenue. For the definition and the formula, see what share of voice in PR measures. For presence in an article versus how much of the article a brand actually occupies, see share of voice versus share of mentions.
What you need to know — TL;DR
Who led the period


Which AI code builder had the highest share of voice?
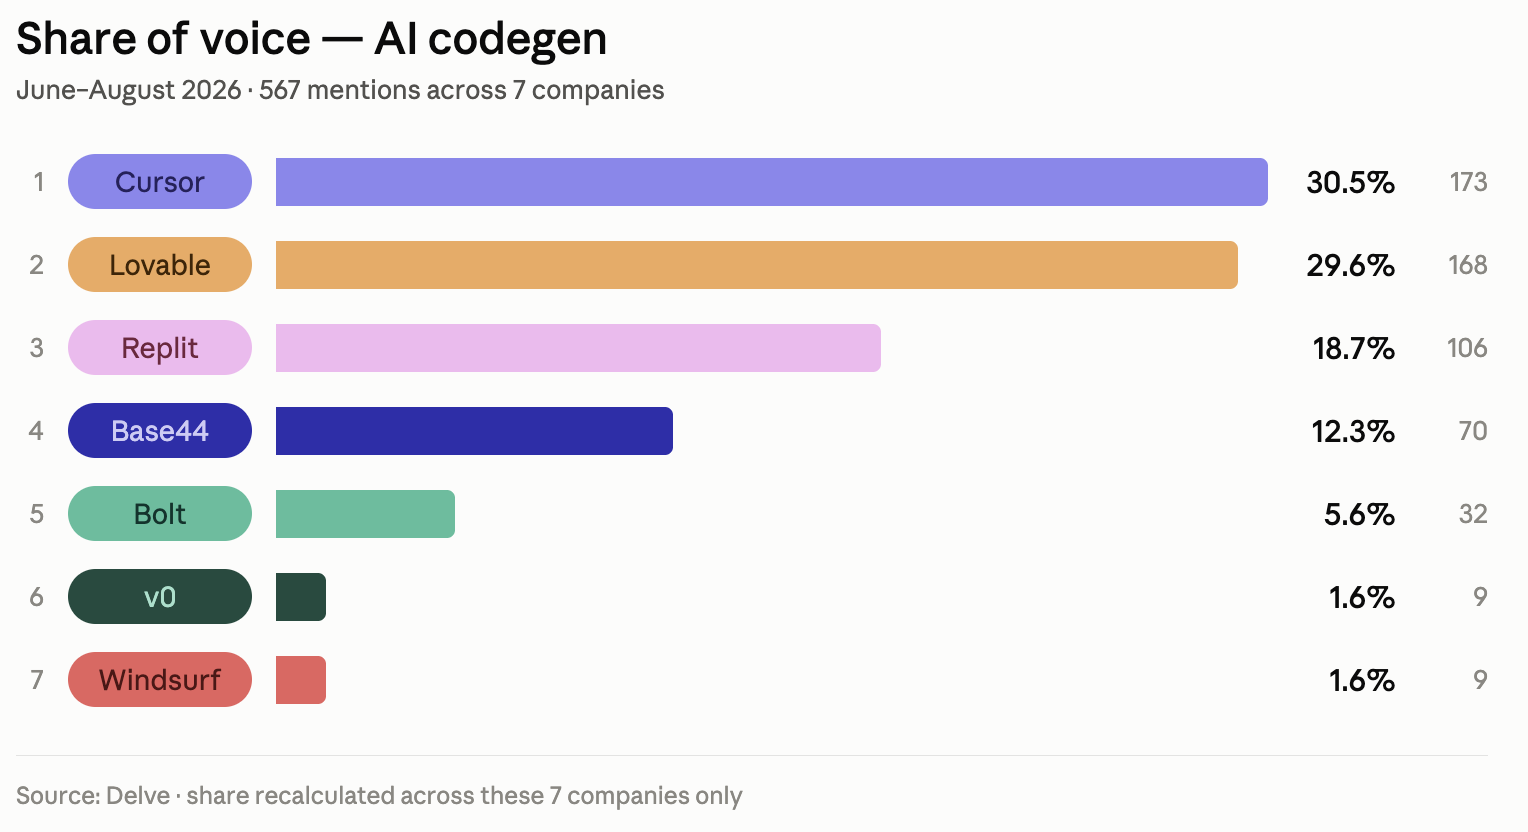
Cursor, with 30.5% of qualifying coverage across the three months, 173 of 567 tracked items.
Who led at the end
Who was ahead in August?
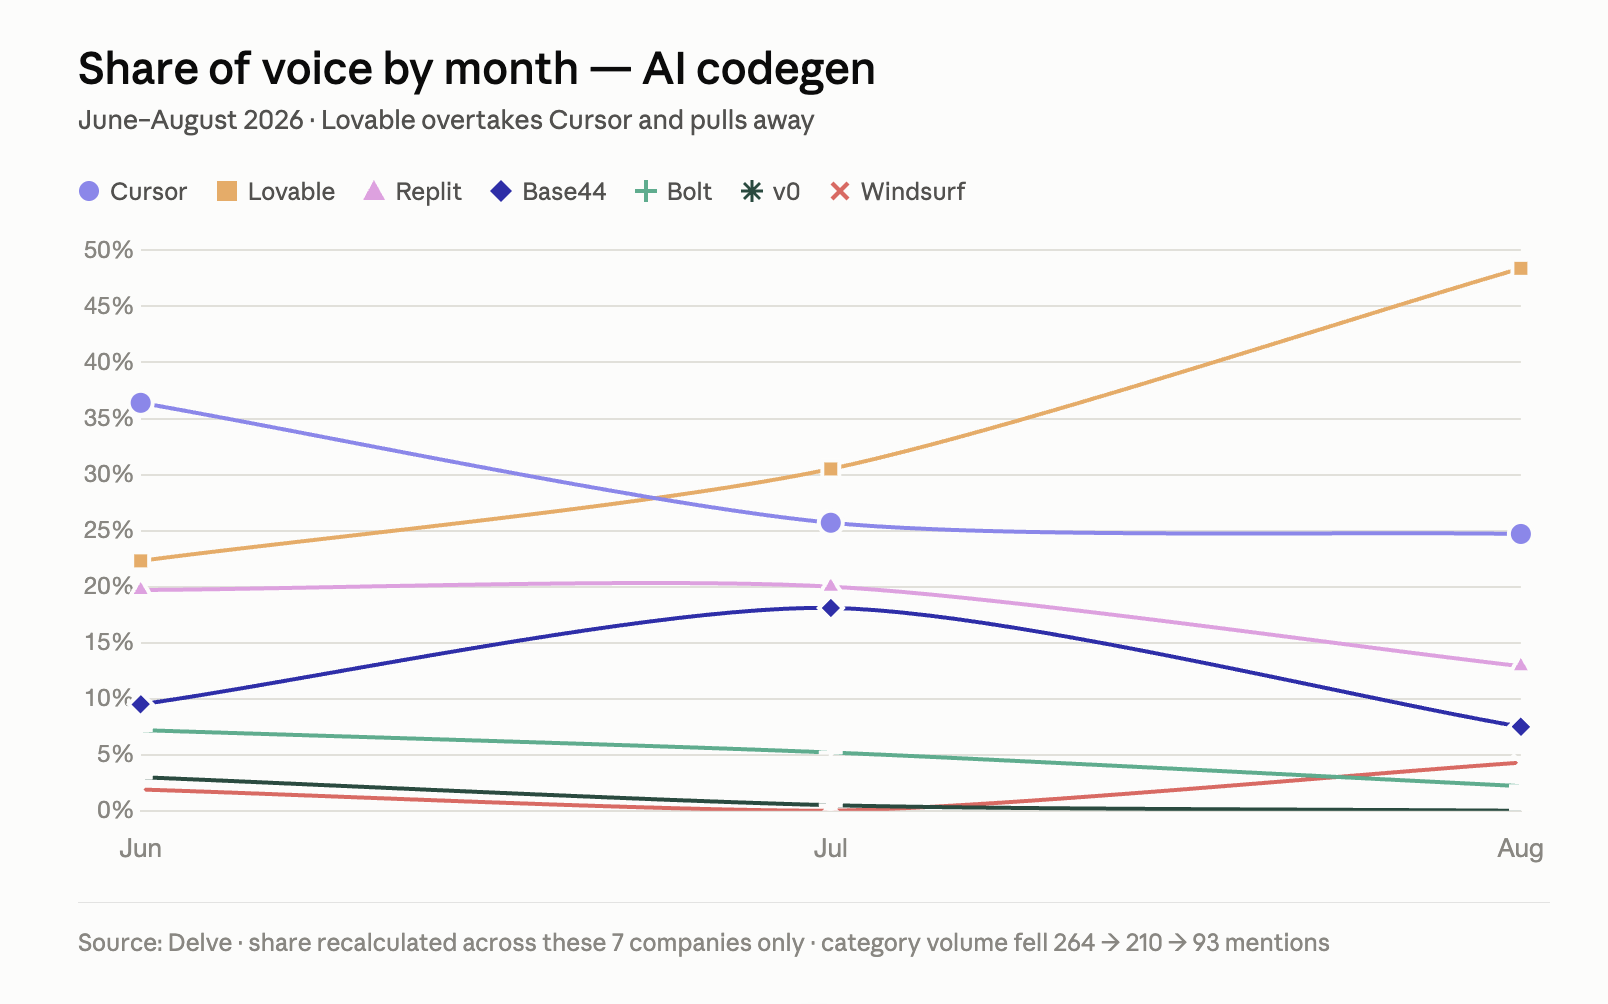
Lovable, at 48.4%. Its share rose from 22.3% in June to 30.5% in July to 48.4% in August, passing Cursor in July and widening the gap after.
The pool shrank while shares moved
Why does that matter?
Category volume fell from 264 items in June to 210 in July to 93 in August. Rising share can mean holding coverage while the pool contracts, not adding clips. Lovable's item count fell too, from 59 to 45.
August is a small sample
How much weight should the August figure carry?
Ninety-three items across seven brands. At that size, a single busy news week moves a brand's share by several points. The direction across three months is more durable than the August number.
What the number is
What does this measure?
Share of coverage inside a fixed set of seven brands. The 567 figure counts brand-article pairs, one point per named brand per article, not 567 separate articles. Add or drop a brand and every percentage changes.
What it is not
What does it not measure?
Quality, sentiment, message pull-through, or product standing. It counts who the press wrote about.
The ranking
Share of voice by month across the seven codegen tools, then the three-month total. Percentages are each brand's qualifying items divided by the seven-brand total for that column.
The charts use looser labels than this post does. They say companies where we say tools, and mentions where the count is brand-article pairs. The numbers are identical; the wording below is the precise version.
| Brand | June | July | August | June to August |
|---|---|---|---|---|
| Cursor | 36.4% | 25.7% | 24.7% | 30.5% |
| Lovable | 22.3% | 30.5% | 48.4% | 29.6% |
| Replit | 19.7% | 20.0% | 12.9% | 18.7% |
| Base44 | 9.5% | 18.1% | 7.5% | 12.3% |
| Bolt | 7.2% | 5.2% | 2.2% | 5.6% |
| v0 | 3.0% | 0.5% | 0.0% | 1.6% |
| Windsurf | 1.9% | 0.0% | 4.3% | 1.6% |
| Seven-brand total (items) | 264 | 210 | 93 | 567 |
Raw item counts behind the table:
| Brand | June | July | August | Total |
|---|---|---|---|---|
| Cursor | 96 | 54 | 23 | 173 |
| Lovable | 59 | 64 | 45 | 168 |
| Replit | 52 | 42 | 12 | 106 |
| Base44 | 25 | 38 | 7 | 70 |
| Bolt | 19 | 11 | 2 | 32 |
| v0 | 8 | 1 | 0 | 9 |
| Windsurf | 5 | 0 | 4 | 9 |
| Total | 264 | 210 | 93 | 567 |
Cursor opened June at 36.4% and gave up nearly twelve points by August, settling near a quarter of the set. Lovable passed it in July and widened the gap in August. That gain did not come from one rival: Cursor and Replit both lost share across the summer, Base44 spiked in July then fell below its June level, and Bolt and v0 declined, with v0 recording no items in August. Windsurf recorded none in July and four in August.
The shape matters as much as the ranking. Lovable's share nearly doubled while its item count fell from 59 to 45. Every brand in the set published fewer tracked items in August than in June. This is a category getting quieter, with Lovable holding more of what remained.
How to read this
A brand can lead the three-month total and be losing the last month. Cursor does that here, and it is the reason to read the monthly cut rather than the average. A summer average hides a shift already underway.
The same limit applies as to any share-of-voice number. This is presence in published coverage. It sits at the output stage of an evaluation program. It tells you who the press wrote about, not what buyers concluded. How to measure PR ROI in 2026 covers where that line falls.
If you want the same math inside a theme, such as trust, pricing, or agents, rather than across all coverage, that is share of voice by custom theme.
How we counted
Delve tracked coverage for seven AI code-building tools, the codegen category, from 1 June to 31 August 2026: Cursor, Lovable, Replit, Base44, Bolt, v0, and Windsurf. The set did not change during the period.
Each article counts once for every tracked brand it names, so a piece covering both Cursor and Lovable counts for each. The 567 figure is therefore a count of brand-article pairs, not unique articles. Share of voice is each brand's count divided by the set total for that column. That is the standard share-of-voice calculation rather than share of mentions, which would count every time a brand appears inside an article rather than once per article. Outlet mix, sentiment, and message pull-through are not in this ranking.
Three limits worth stating plainly:
The set is a choice, not a census. These seven were selected as the most visible tools in the category. Adding or removing one changes every percentage in the table.
Some of these are products inside larger companies. Coverage of a parent company that does not name the tool is not counted here, which can understate a brand whose news tends to run under its parent's name.
August is thin. Ninety-three items across seven brands means small absolute changes produce large percentage swings. Treat the August column as directional.
One brand needs a note. Cognition acquired the Windsurf product and brand in 2025, so Windsurf was not an independent company during this period. It stays in the set because the seven are fixed for the series, and because thin named coverage is a finding rather than a gap.
This is the first in a quarterly series. The next update will use the same seven brands so the comparison holds. Later cuts will look at other categories, starting with cybersecurity.
Frequently Asked Questions
Who led share of voice among AI code builders in summer 2026?
Cursor, with 30.5% of qualifying coverage across a set of seven tools from June through August 2026. Lovable led the final month at 48.4%, having passed Cursor in July.
Which AI code builder gained the most share of voice?
Lovable, rising from 22.3% in June to 48.4% in August. Its item count fell over the same period, from 59 to 45, while the category pool contracted faster.
Does a higher share of voice mean better coverage?
No. It means a larger share of the articles in this set. Tone, message pull-through, and outlet quality are separate measures and are not included in this ranking.
Why did total coverage fall so sharply?
The set produced 264 tracked items in June and 93 in August. This report does not establish the cause. Summer news cycles and a quieter product calendar are both plausible and neither is measured here.
Why is Windsurf in the set?
Cognition acquired the Windsurf product and brand in 2025, so it is not an independent company in this period. It stays because the set is fixed for the series, and because thin named coverage is itself a finding.
Will this ranking be updated?
Yes. The same seven brands will be reported next quarter so the comparison holds. Other categories will be separate reports, starting with cybersecurity.